Categories > Guides and Tips

2024 Income Inequality Statistics in Canada | A Growing Divide

- Key Insights
- Provincial-Level Income Inequality in Canada
- Income Trends Across Different Groups in Canada
- Demographic Breakdown of Income Inequality in Canada
- Implications of Age on Income and Debt
- Income Gap Based on Gender in Canada
- Costs and Consequences of Income Inequality in Canada
- Canada's Potential Interventions and Solutions to Income Inequality
- References
Key Insights
| • In Q2 2024, Statistics Canada highlighted a record-breaking 47 percentage point gap between high and low-income households in Canada. • The wealthiest 20% of households in Canada controlled 67.7% of the nation’s wealth in 2024, as reported by Statistics Canada. • Ontario’s top 1% earned 11.4% of the province’s total income in 2021, according to the Distributional National Accounts. • Statistics Canada noted that in Q2 2024, individuals under 35 allocated 12.2% of their disposable income to interest-only payments on credit market debt. • Men’s average hourly wage in Canada saw an increase from $37.28 in July to $38.03 in November 2024, reported by Statistics Canada. • Women’s average hourly wage in Canada rose from $32.50 in July to $33.24 in November 2024, as per Statistics Canada’s findings. • In 2022, Statistics Canada revealed that women constituted just 25.6% of the top 1% of earners in Canada. |
Income inequality in Canada is at an all-time high and is growing rapidly.
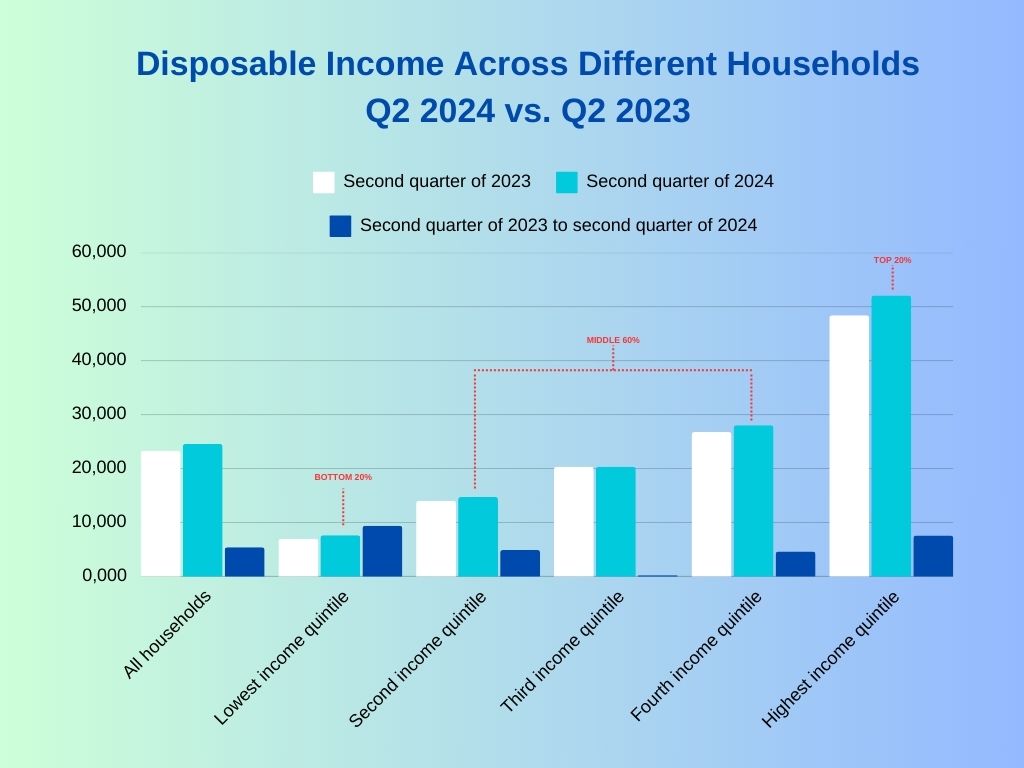
Statistics Canada states that, as of the second quarter of 2024, the difference in disposable income between the richest 40% and the poorest 40% of households stood at 47 percentage points. This is the largest gap ever recorded since data tracking began in 1999.
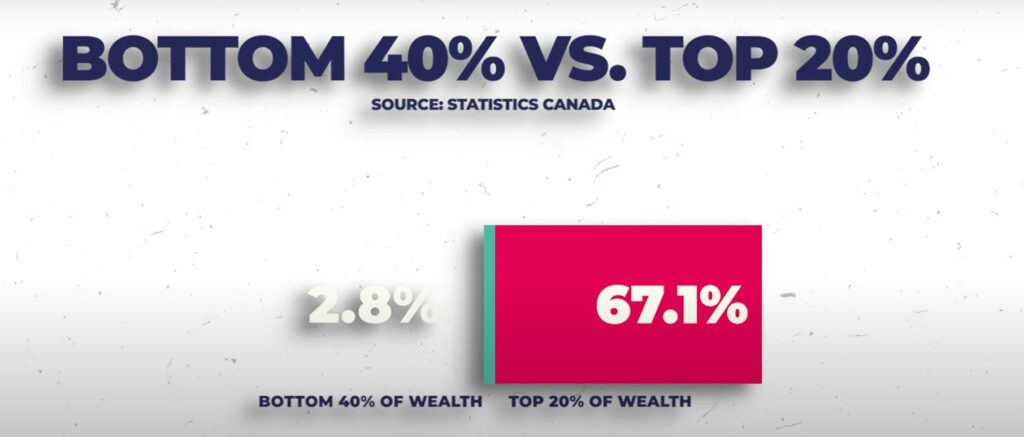
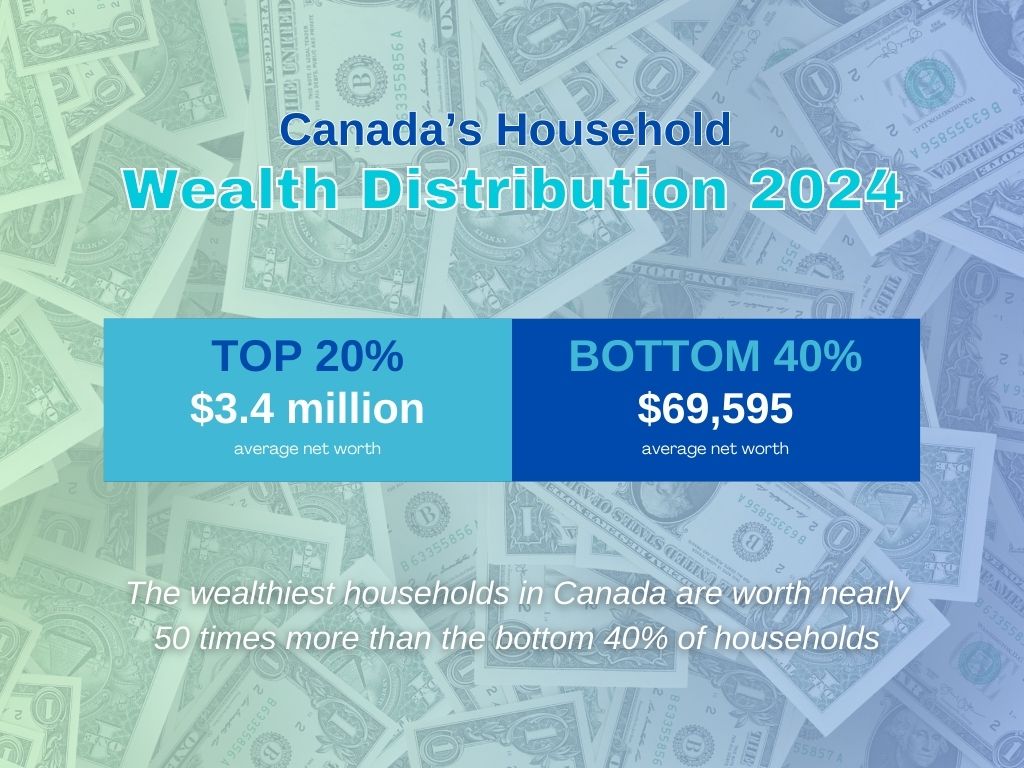
This gap is also mirrored in overall net worth. The wealthiest 20% of Canadian households now hold 67.7% of the nation’s wealth, with an average net worth of $3.4 million.
Meanwhile, Statistics Canada reported that the bottom 40% control just 2.8%, averaging only $69,595 in total wealth.
Simply put, the wealthiest households in Canada are worth nearly 50 times more than the bottom 40% of households.
Provincial-Level Income Inequality in Canada
Income inequality in Canada has significant differences between provinces.
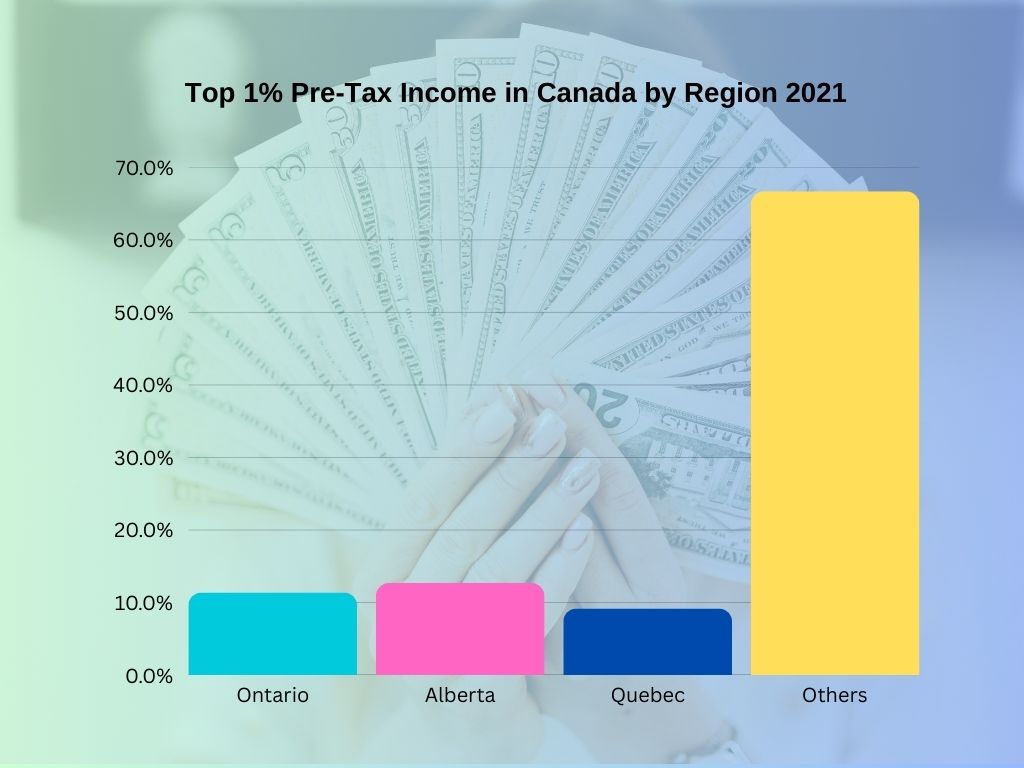
| Region | Top 1% share of pretax regional income (%) 2021 |
| Ontario | 11.4% |
| Alberta | 12.7% |
| Quebec | 9.2% |
| Others | 66.7% |
Data from the Distributional National Accounts (DINA) for 2021 reveals significant provincial disparities in income concentration.
Ontario, with its strong financial sector and high-paying executive roles, has the highest share of income accruing to the top 1%, with 11.4% of the total income.
On the other hand, Quebec, with its emphasis on social programs and progressive taxation, has a more equitable distribution. Its top 1% only captures 9.2% of the income.
Alberta sits between the two, with 12.7% of income going to the top 1%. The province experiences income fluctuations and increased inequality due to its reliance on the oil and gas-dependent economy.
These differences show how local economic conditions and policies can significantly influence wealth distribution across Canada.
Income Trends Across Different Groups in Canada
Statistics Canada (2024) highlights a growing gap in income distribution across Canada.
The top 20% of earners, with an average income increase of 7.6% in 2024, now hold the largest share of disposable income. This group benefits significantly from financial assets, which make up 58.5% of their total wealth, allowing them to capitalize on high interest rates and strong investment returns.
Middle-income households, comprising 60% of the population, have faced a decrease in their disposable income share. This decline is attributed to rising interest rates, which increase the burden of mortgage and credit card payments.
The lowest 20% of earners saw a 14.3% increase in disposable income, averaging $417, but rising interest costs offset much of this gain.
These households primarily rely on wage growth, particularly in sectors like healthcare and education. This dependence makes them susceptible to economic instability as they have limited investment income.
Wealthier households are advancing, while middle- and low-income families face increasing strain, highlighting the need to address income inequality for a balanced economy.
Demographic Breakdown of Income Inequality in Canada
Implications of Age on Income and Debt
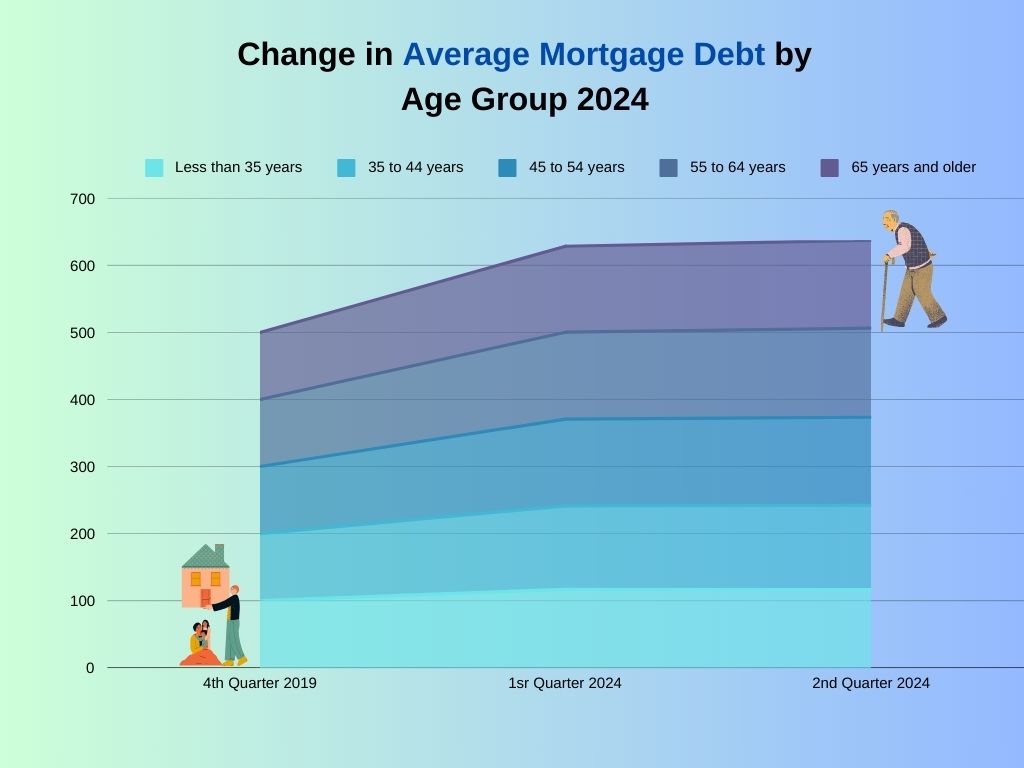
According to Statistics Canada, there is a widening financial gap between younger and older Canadians. Those 65 and older enjoy rising incomes, primarily from growing retirement benefits.
Meanwhile, younger Canadians, particularly those under 35, struggle with stagnant or declining incomes. Despite a recent 14.3% disposable income increase, it’s insufficient to offset rising living costs. With this, many may be delaying homeownership or downsizing to manage costs.
Younger households are reducing mortgage debt, but at a slower pace (3% in Q2 2024) and face a significant burden from rising credit card interest payments (12.2% of disposable income in mid-2024). This is partly due to higher interest rates for younger borrowers (under 35).
Conversely, older Canadians are experiencing more positive financial trends.
Households aged 55-64 and 65+ only saw an increase in mortgage debt in Q2 2024, with a 6.5% rise for the 55-64 age group and a 6.4% rise for those 65 and older. This is likely due to accumulated wealth and lower interest rate vulnerability.
They are also less impacted by rising interest rates and often help younger family members purchase homes.
Overall, this disparity highlights the growing financial insecurity of younger Canadians. Younger Canadians face high debt and affordability issues, while older Canadians benefit from financial security through retirement income and investments.
Income Gap Based on Gender in Canada
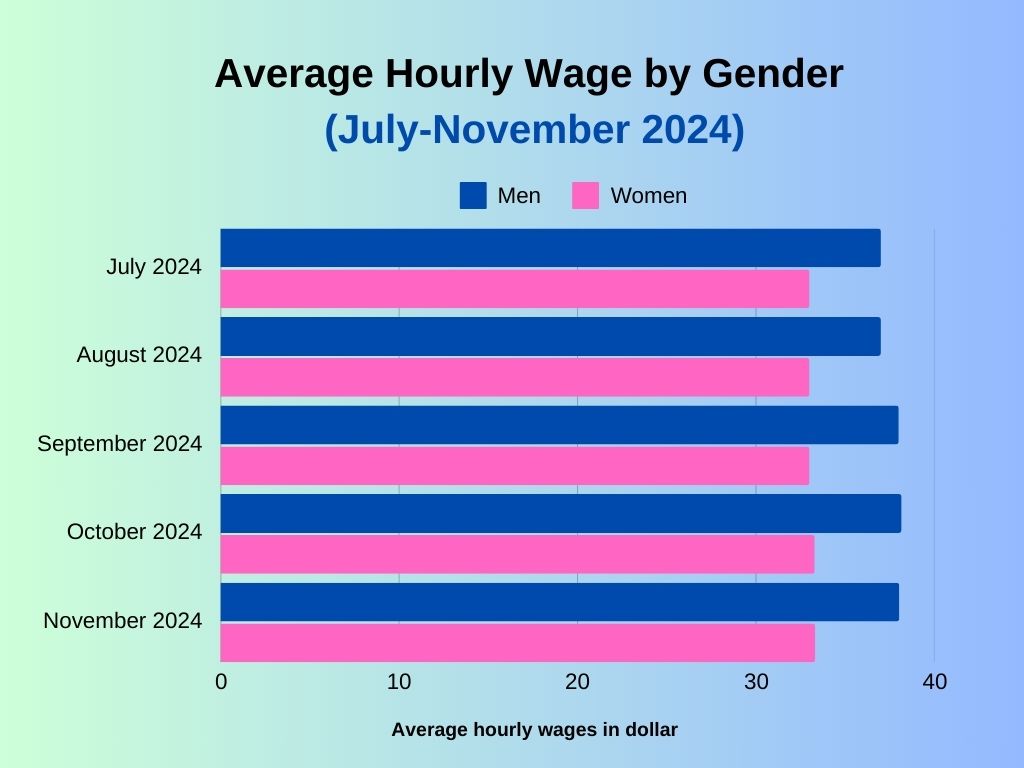
Reports from Statistics Canada (2024) show that the income gap between men and women in Canada persists.
Men’s average hourly wage increased from $37.28 in July 2024 to $38.03 in November, while women’s wages grew more slowly, from $32.50 to $33.24.
On average, women earn $5 less per hour than men, reflecting persistent pay disparities.
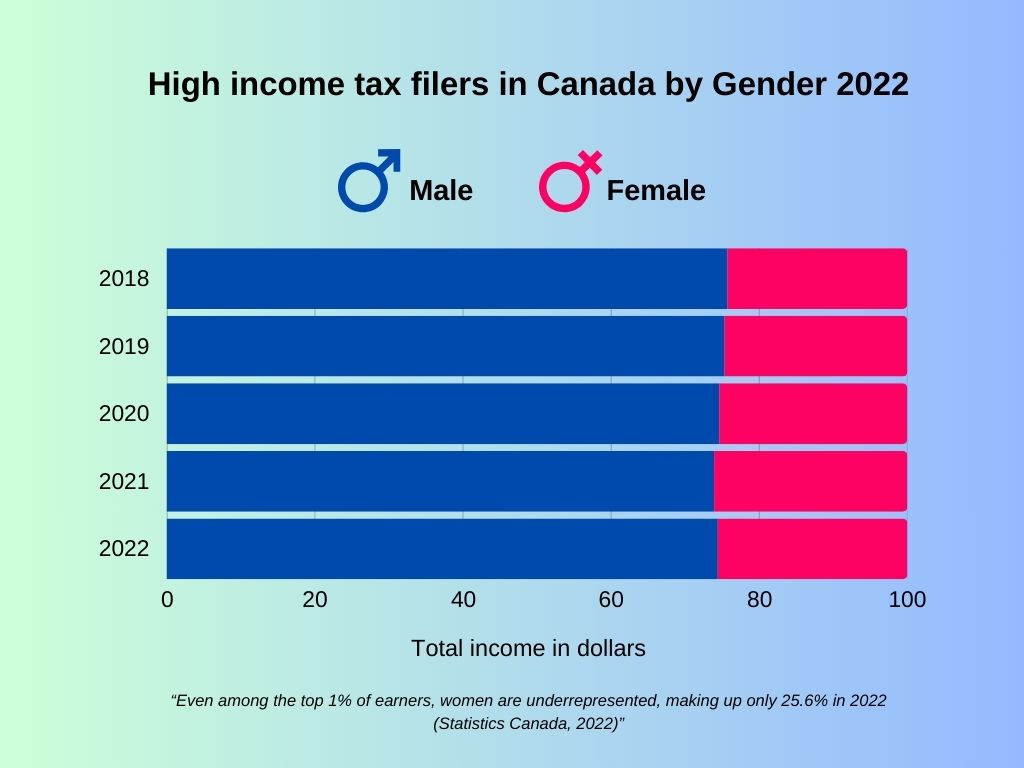
The gap extends beyond wages. About 60% of Canadians in the bottom 50% income group are women, a figure unchanged for over 40 years. Even among the top 1% of earners, women are underrepresented, making up only 25.6% in 2022 (Statistics Canada, 2022).
While women’s incomes have improved since 1976, barriers such as unequal pay, limited leadership roles, and societal caregiving expectations continue to keep many women in lower-paying jobs or out of the workforce.
Costs and Consequences of Income Inequality in Canada

Income inequality in Canada goes beyond financial disparities—it limits opportunities and impacts overall well-being.
The Canadian Centre for Policy Alternatives (2024) found that individuals from low-income families are five times less likely to reach the top income bracket.
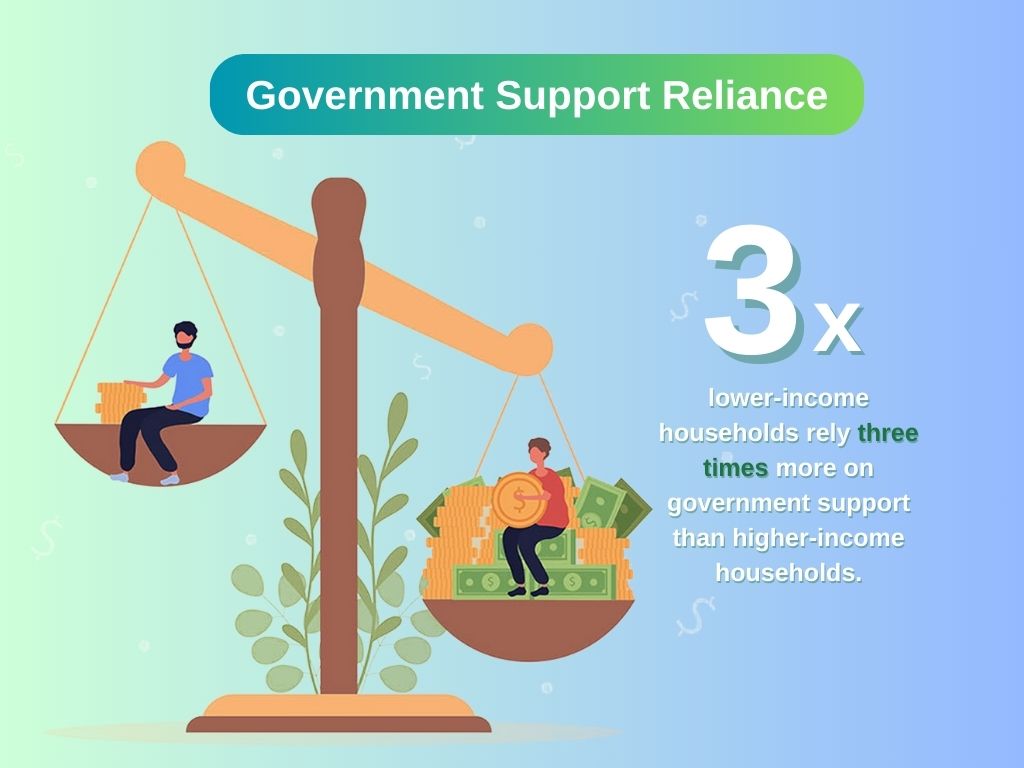
The OECD also notes that when low-income households lack access to quality education and resources, this reduces productivity and strains public services. According to Statistics Canada, lower-income households rely three times more on government support than higher-income households.
The social impacts of income equality are equally concerning. The Canadian Institute for Health Information reports that people in the lowest income group live 6.5 years less than those in the highest income group.
Income inequality also leads to higher crime rates. This is evidenced by higher property crime rates in provinces with greater disparities, such as British Columbia (Statistics Canada, 2022).
Trust in institutions is also affected—only 45% of lower-income Canadians trust the government, compared to 75% of wealthier citizens (Environics Institute, 2023).
Reducing income inequality isn’t just about fairness; it’s essential for creating a healthier, safer, and more equitable society.
Canada’s Potential Interventions and Solutions to Income Inequality
One key solution to income inequality in Canada is progressive taxation. By raising taxes on the wealthy, Canada could generate substantial revenue.
For example, the Canadian Tax Foundation (2019) estimates that taxing the top 1% more could yield $6 billion annually.
Furthermore, a 1% tax on wealth over $20 million could generate around $10 billion in its first year, almost double the initial estimate by the Parliamentary Budget Officer. This could be a significant boost compared to the earlier $5.6 billion prediction (Canadian Centre for Policy Alternatives, 2021).
Social programs are also a crucial solution. While the National Housing Strategy aims to construct 100,000 affordable homes by 2030, experts suggest this may not be sufficient.
In education, increasing grants for low-income students has led to a 20% rise in enrollment (Government of Canada).
Raising the minimum wage and supporting unions in low-wage sectors can also help reduce poverty and mitigate wage gaps (Canadian Labour Congress).
Together, these measures may reduce income inequality in Canada and create a fairer society.
References
- Canada, I. (2024, December 19). Housing, Infrastructure and Communities Canada – Canada’s National Housing Strategy. https://housing-infrastructure.canada.ca/housing-logement/ptch-csd/index-eng.html
- Canadian Institute for Health Information. (2015). Trends in Income-Related Health Inequalities in Canada. https://www.cihi.ca/sites/default/files/document/summary_report_inequalities_2015_en.pdf
- Foundry. (2024, January 28). Wealth tax would raise much more revenue than previously calculated by Parliamentary Budget Officer. CCPA. https://www.policyalternatives.ca/news-research/wealth-tax-would-raise-much-more-revenue-than-previously-calculated-by-parliamentary-budget-officer/#:~:text=A%20one%20per%20cent%20tax,by%20the%20CCPA%2DBC%20shows.
- Government of Canada, Statistics Canada. (2022, April 26). Violent victimization and perceptions of safety: Experiences of First Nations, Métis and Inuit women in Canada. https://www150.statcan.gc.ca/n1/en/catalogue/85-002-X202200100004
- Government of Canada, Statistics Canada. (2024a, October 10). The Daily — Distributions of household economic accounts for income, consumption, saving and wealth of Canadian households, second quarter 2024. https://www150.statcan.gc.ca/n1/daily-quotidien/241010/dq241010a-eng.htm
- Government of Canada, Statistics Canada. (2024b, October 28). High income tax filers in Canada. https://www150.statcan.gc.ca/t1/tbl1/en/tv.action?pid=1110005501
- Government of Canada, Statistics Canada. (2024c, December 6). Average usual hours and wages by selected characteristics, monthly, unadjusted for seasonality, last 5 months. https://www150.statcan.gc.ca/t1/tbl1/en/tv.action?pid=1410032001&pickMembers%5B0%5D=3.4&cubeTimeFrame.startMonth=07&cubeTimeFrame.startYear=2024&cubeTimeFrame.endMonth=11&cubeTimeFrame.endYear=2024&referencePeriods=20240701%2C20241101
- Macdonald, D. (2024, September 11). How the public sector is fighting income inequality (and why it’s still not enough). CCPA. https://www.policyalternatives.ca/news-research/how-the-public-sector-is-fighting-income-inequality-and-why-its-still-not-enough/
- Milligan, K. (2019). The Future of the Progressive Personal Income Tax: How High Can It Go? Canadian Tax Journal/Revue Fiscale Canadienne, 693–710. https://doi.org/10.32721/ctj.2019.67.3.sym.milligan
- Minimum Wage – Minimum Wage. (2020, February 6). Minimum Wage. https://minimumwage.canadianlabour.ca/
- OECD temporary archive. (2024, June 21). https://web-archive.oecd.org/temp/2024-06-21/64022-income-distribution-database.htm
- Trust in Political Institutions in Canada Trends, 2010 to 2023. (2023). In AmericasBarometer [Report]. https://www.environicsinstitute.org/docs/default-source/default-document-library/see-the-survey-results.pdf?sfvrsn=638e55bc_1
- Xuereb, S., Fisher-Post, M., Delorme, F., Lajoie, C., World Inequality Lab, Paris School of Economics, University of Massachusetts, Amherst, Research Center in Taxation and Public Finance, University of Sherbrooke, & London School of Economics. (2023). INCOME INEQUALITY IN CANADA AT THE NATIONAL AND SUBNATIONAL LEVELS 1982-2021. https://wid.world/wp-content/uploads/2023/12/WorldInequalityLab_WP2023_27_Income-inequality-in-Canada_Final.pdf